Should You Buy the Dip After the Midterms? What History Says and What Could Go Wrong
The S&P 500 has historically gained 15% after midterm elections, but corrections can still be painful. Is now the right time to buy an S&P 500 ETF, or should investors wait for better opportunities in 2027?

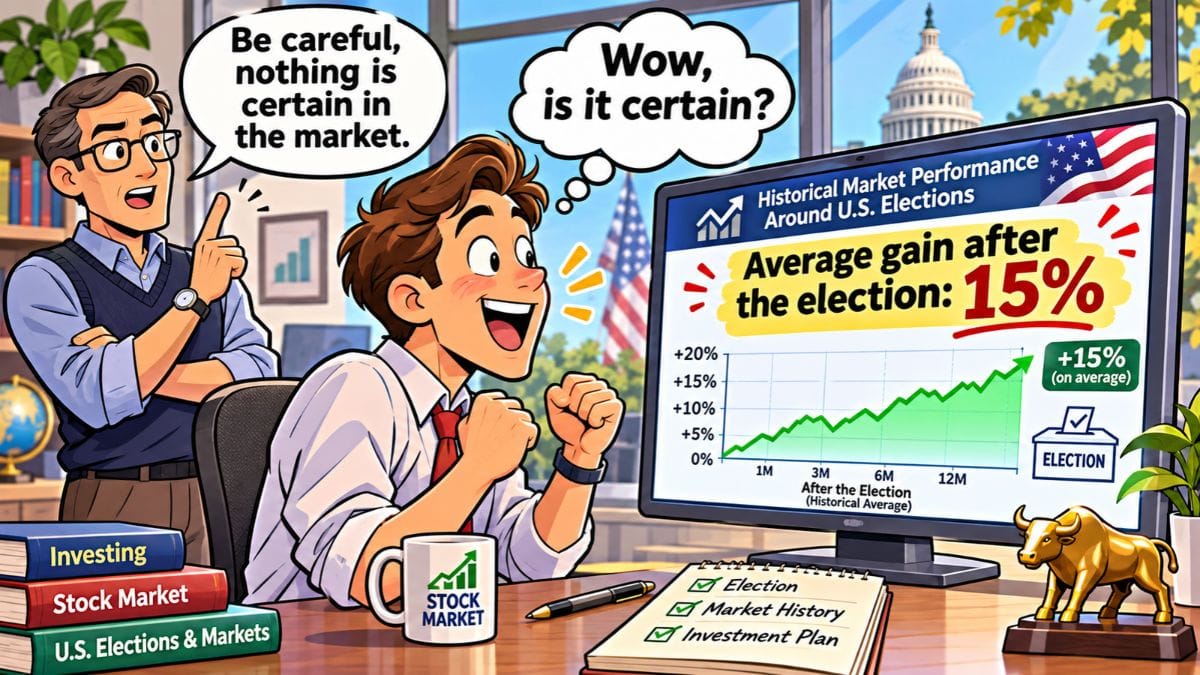
Mikirduit – U.S. stocks have pulled back meaningfully around the 2026 midterm elections. Some commentators say there is no reason to worry, pointing to history: the S&P 500 has gained about 15% on average in the year after a midterm. But does that make this a good time to buy an S&P 500 index ETF? The answer depends on more than a historical average.
Key Takeaways
- Since 1950, the S&P 500 has risen an average of about 15% in the 12 months after a midterm election, but individual outcomes ranged from roughly flat to more than 20%.
- The index has typically dipped before recovering. The average peak-to-trough decline in the following year was about 11.6%.
- Analysts disagree on the outlook. J.P. Morgan Asset Management sees a supportive backdrop, while Mikirduit sees elevated risk tied to oil prices, inflation, and the Federal Reserve.
- Neither view is a guarantee. Investors who choose to buy may want to spread purchases over time and invest only money they will not need in the near term.
The Bullish Case from J.P. Morgan
Jordan Jackson, Capital Markets Strategist at J.P. Morgan Asset Management, calls the 15% average an impressive record. He cautions, however, that every midterm cycle unfolds against a different economic backdrop. He points to five features of the current environment:
- Strong earnings growth. Analysts expect earnings to grow about 37% over the next 12 months. Valuations have already corrected by roughly 15%, which he says offers a more attractive entry point than at the start of the year.
- A resilient economy. U.S. GDP is expected to grow about 2% through 2027, enough to support corporate revenue and keep recession risk contained.
- A robust capital spending cycle. Business investment, led by AI infrastructure, continues to boost growth and profits.
- A less hawkish Fed than feared. Jackson expects the Federal Reserve to tighten less than markets currently anticipate, which could ease pressure on bond markets and discount rates.
- Depressed consumer sentiment. Historically, lows in consumer sentiment have often been bullish for stocks, because they tend to coincide with peak pessimism already reflected in prices. Sentiment today is very weak.
Based on these factors, Jackson favors long-term investing and diversification over short-term trading.
Note: These are forecasts and opinions, not certainties. Earnings and GDP projections can be revised, and the market may not behave as expected.
What the Historical Data Actually Shows
According to FactSet, Standard & Poor’s, and J.P. Morgan Asset Management (data as of October 6, 2026), the S&P 500 has risen an average of 15.1% in the 12 months after midterm elections. Across 19 midterm cycles, the range of outcomes is wide:
| 12-month return after midterms | Number of periods | Years |
|---|---|---|
| 20–25% | 5 | 1954, 1962, 1990, 1994, 1998 |
| 15–20% | 3 | 1950, 1974, 1982 |
| 10–15% | 6 | 1958, 1966, 1970, 2002, 2018, 2022 |
| 5–10% | 2 | 1978, 2006 |
| 0–5% | 3 | 1986, 2010, 2014 |
The path to those gains was often bumpy. The index typically fell before it recovered, with an average peak-to-trough decline of about 11.6% in the following year:
| Peak-to-trough decline | Number of periods | Years |
|---|---|---|
| 0–10% | 8 | 1950, 1958, 1962, 1966, 1982, 1990, 1994, 2006 |
| 10–15% | 8 | 1954, 1970, 1974, 1978, 1998, 2002, 2014, 2022 |
| 15–20% | 2 | 2010, 2018 |
| More than 20% | 1 | 1986 |
What this means: A 15% average is not a promise. In 3 of 19 cycles, gains were only 0–5%. Drawdowns of 15% or more happened in 3 of 19 cycles. Those worse outcomes are uncommon, but they do occur. Also keep in mind that 19 observations is a small sample, and past performance does not guarantee future results.
A More Cautious View
Surya Rianto, Founder of Mikirduit, reads the situation differently and sees market risk as still elevated. These are Mikirduit’s own assessments and forecasts, not established facts:
- Oil and inflation. If Brent or WTI crude stays above $90 a barrel, especially heading into winter, inflation could climb significantly. Mikirduit sees a potential Fed rate hike between December 2026 and March 2027, and further hikes are possible if oil is still above $90 in March 2027.
- Pressure on AI spending. Higher rates would raise financing costs for companies expanding into AI. If tightening continues, some may slow capital spending. Access to power generation and water for cooling is also getting harder to secure, and slower economic growth could reduce how much revenue AI investments generate relative to expectations.
- Risk for AI suppliers. If AI capital spending slows, infrastructure suppliers such as Nvidia (NVDA) and its peers could see orders delayed or canceled, reducing production volumes. (This is a discussion of risk, not a recommendation about any individual stock.)
- Consumer spending. Higher rates could also weigh on consumer-focused sectors as the economy slows.
Given these risks, Mikirduit believes the best entry prices may still be ahead in 2027. The exception would be a drop in oil to roughly $75–$83 a barrel by the end of 2026, which could change the outlook.
Comparing the Two Views
| J.P. Morgan Asset Management | Mikirduit | |
|---|---|---|
| Overall stance | Supportive backdrop for stocks | Elevated risk; better entry may come in 2027 |
| Fed outlook | Less tightening than markets expect | Possible hikes from December 2026 to March 2027 |
| AI spending | Tailwind for growth and profits | Could slow if financing costs rise |
| Key variable | Earnings growth and valuations | Oil staying above or falling below $90 |
What Investors Can Do
No one can reliably time the market, and reasonable analysts disagree here. A few general principles may help:
- Consider dollar-cost averaging. Investing a fixed amount each month spreads your purchases across different prices, which can reduce the risk of buying everything at a peak. It does not guarantee a profit or protect against losses in a falling market.
- Match your money to your time horizon. Mikirduit suggests investing only funds you will not need for at least three years. Money needed sooner generally should not be exposed to stock market swings.
- Diversify. Avoid concentrating in a single stock, sector, or theme.
- Know your risk tolerance. If a 10–15% decline would cause you to sell in a panic, a more conservative allocation may suit you better.
- Understand the alternatives. A U.S. Treasury bond ETF is generally less volatile than stocks, but it is not risk-free. Bond prices can fall when interest rates rise, and returns may lag stocks over long periods.
Frequently Asked Questions
Is it safe to buy an S&P 500 ETF after a market pullback?
No investment is “safe.” Historically, the S&P 500 has often recovered after post-midterm dips, but there is no guarantee it will this time.
Does the 15% post-midterm average mean I should expect 15%?
No. It is an average across many different years. Actual results ranged from roughly 0–5% to more than 20%.
What is dollar-cost averaging?
It means investing the same dollar amount at regular intervals, such as monthly, regardless of price.
Methodology and Sources
This article summarizes market commentary from J.P. Morgan Asset Management and Mikirduit, along with historical S&P 500 data compiled by FactSet, Standard & Poor’s, and J.P. Morgan Asset Management as of October 6, 2026. Forecasts quoted here are the opinions of the named analysts and may change. We have not independently verified third-party projections.
- J.P. Morgan Asset Management: https://am.jpmorgan.com/us/en/asset-management/institutional/insights/market-insights/market-updates/on-the-minds-of-investors/how-do-markets-perform-post-midterms/
- Mikirduit original analysis
- U.S. Securities and Exchange Commission, Investor.gov, “Introduction to Investing”: https://www.investor.gov
Mikirduit US provides independent financial research and educational content. This article is not personalized investment advice, and investors should conduct their own research before making investment decisions.