What Another 25–50 Basis Points of Fed Tightening Could Mean for AI Stocks
Another 25–50 basis points of Fed tightening may not end the AI boom, but it could expose weak financing, slower cloud demand and cracks across the data-center supply chain.

Mikirduit — The Federal Reserve has raised its benchmark interest rate by 25 basis points to a range of 3.75% to 4.00%, turning investor attention to the possibility of another 25 to 50 basis points of tightening before year-end.
3 Key Takeaways
- A further 25–50 basis points of Fed tightening would likely pressure AI-stock valuations first, while a true fundamental slowdown would require signs such as lower hyperscaler CapEx, weaker RPO growth and softer supplier demand.
- Microsoft, Amazon and Alphabet still show strong AI compute utilization through rapid cloud growth, tight capacity, rising AI usage and strong monetization, although depreciation and infrastructure costs are climbing.
- The clearest warning signs for an AI downturn would be slower data-center revenue at Nvidia, Marvell and AMD, weaker Arista networking orders, rising inventory risk at Super Micro and Dell, and a sustained decline in Vertiv backlog.
If total Fed rate increases in 2026 reach 50 to 75 basis points, what would that mean for artificial-intelligence stocks and the broader AI infrastructure trade?
We previously analyzed the impact of a single 25-basis-point increase on AI-related companies. The conclusion was relatively straightforward: one hike alone was unlikely to materially disrupt hyperscale data-center expansion. Our analysis of the impact of the Federal Reserve's previous 25 bps rate hike can be read here.
The more important question now is what happens if the Fed tightens again.
Two meetings remain this year, on Oct. 28 and Dec. 9, 2026. As of Sept. 17, CME FedWatch showed roughly a 53% probability of a 25-basis-point increase in October, versus about a 47% probability of no change.
December pricing was even more notable.
The two largest implied scenarios were:
- A 25-basis-point increase to 4.00%–4.25%, with a probability of about 48.4%.
- A 50-basis-point increase to 4.25%–4.50%, with a probability of about 39.7%.
That implies the market was assigning roughly an 88% combined probability of higher rates by December, versus only about 11.9% for rates remaining at 3.75%–4.00%.
That does not mean another hike is guaranteed. Inflation remains the key variable. If U.S. inflation falls below 3%, even to around 2.9%, the Fed could have more room to hold rates steady.
But if another 25 to 50 basis points of tightening arrives, the AI trade could begin to separate into two groups: companies with strong balance sheets and self-funded expansion, and companies that rely heavily on leverage, working capital or external financing.
The Most Rate-Sensitive AI Names
Among companies directly funding AI expansion, Oracle Corp. (NYSE: ORCL) and CoreWeave Inc. (NASDAQ: CRWV) remain among the more financially sensitive names.
Among AI infrastructure suppliers, the higher-risk group includes Nvidia Corp. (NASDAQ: NVDA), Super Micro Computer Inc. (NASDAQ: SMCI), Broadcom Inc. (NASDAQ: AVGO), Marvell Technology Inc. (NASDAQ: MRVL) and Dell Technologies Inc. (NYSE: DELL).
If the Fed raises rates by only another 25 basis points, the direct impact should still be manageable for the broader AI ecosystem.
The pressure would be most visible at CoreWeave and Super Micro.
CoreWeave is especially sensitive because much of its debt carries floating interest rates. With another 25-basis-point increase, bringing cumulative 2026 hikes to 50 basis points, annual interest expense could rise by roughly $60 million relative to the earlier rate environment.
The bigger issue is that CoreWeave is still spending heavily on GPUs and data-center construction, requiring additional financing at potentially higher borrowing costs.
Super Micro is less exposed to rates than CoreWeave, but its working-capital requirements make it vulnerable in a different way.
The company has roughly $4.05 billion of floating-rate debt. A cumulative 50-basis-point increase could add about $20 million in annual interest expense.
That is manageable by itself.
The bigger risk is that Super Micro needs to buy GPUs, memory, networking equipment, server racks and liquid-cooling components before it fully recognizes revenue from projects. If customer deployments are delayed, inventory remains on the balance sheet longer while cash conversion slows.
A further 25-basis-point increase may still be too small to materially disrupt hyperscale projects.
A further 50 basis points, however, would begin to test the economics of the AI buildout more meaningfully.
Oracle and CoreWeave would face greater financing pressure. Super Micro and Dell could see more working-capital strain. Nvidia and Marvell would become more exposed if customers begin revising their capital-spending plans.
 Surya Rianto
Eight Indicators That Could Determine the Next Phase of the AI Boom
There are eight factors investors should watch if the Fed continues tightening.
1. 2027 CapEx Guidance From Amazon, Alphabet, Microsoft and Meta
The first and most important signal will come from four of the largest technology spenders:
Amazon.com Inc. (NASDAQ: AMZN)
Alphabet Inc. (NASDAQ: GOOGL)
Microsoft Corp. (NASDAQ: MSFT)
Meta Platforms Inc. (NASDAQ: META)
These companies sit near the top of the AI infrastructure spending chain.
Their capital budgets directly affect demand for:
- GPUs
- networking equipment
- servers
- data centers
- power infrastructure
- cooling systems
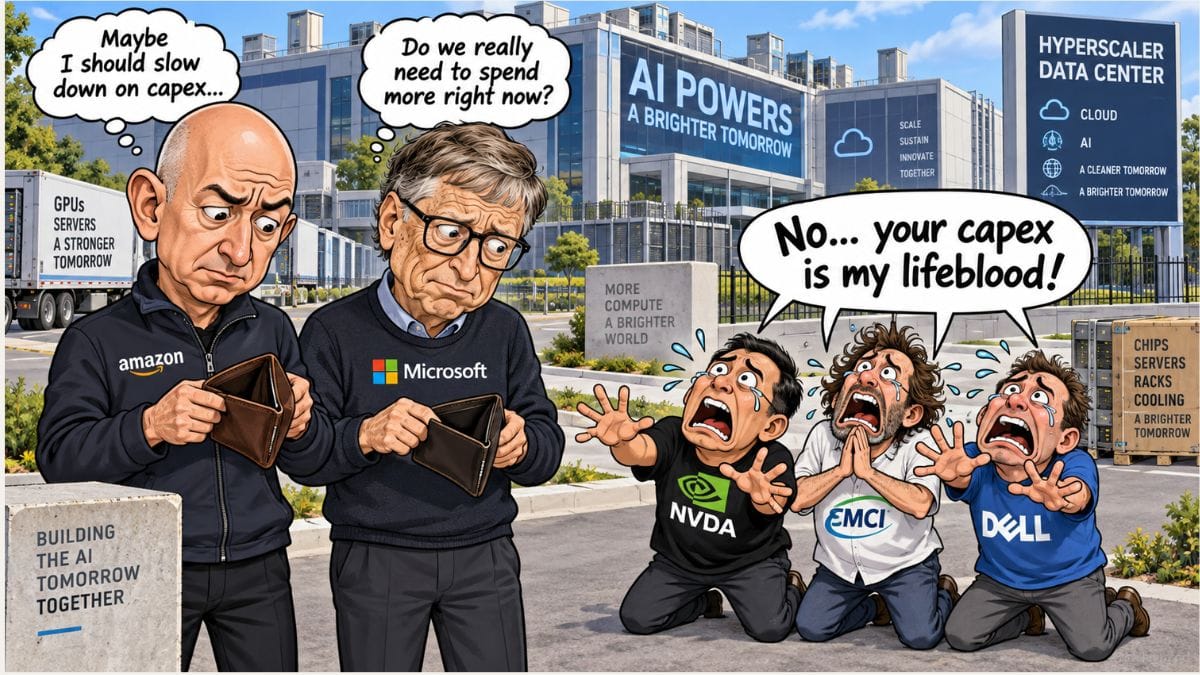
If one or more of these companies begins cutting 2027 CapEx guidance after additional Fed hikes, that could be the first clear sign that higher rates are starting to affect the AI investment cycle.
That would matter across the supply chain, particularly because many suppliers have already purchased large amounts of GPUs, memory and related components at elevated prices.
If another 25 to 50 basis points of tightening arrives without any meaningful downward revision to hyperscaler CapEx guidance, the broader AI boom would likely remain intact.
2. Remaining Performance Obligations, or RPO
The second indicator is Remaining Performance Obligations, or RPO.
RPO represents customer contracts that have already been signed but have not yet been fully recognized as revenue.
This matters because one of the strongest arguments supporting huge AI capital budgets is that future demand is already contractually visible.
Microsoft, for example, reported commercial RPO of about $678 billion, up 84%.
Roughly 30% is expected to convert into revenue over the next 12 months, with the remainder recognized after that.
Microsoft has also said that its fourth-quarter 2026 RPO growth included customers beyond frontier-model companies, suggesting that demand is not dependent on only one or two major AI labs.
Oracle, meanwhile, reported roughly $664 billion in RPO after booking more than $30 billion of new AI Cloud contracts in fiscal first-quarter 2027.
As long as RPO continues rising, higher capital spending still appears backed by real customer demand.
The warning sign would be:
CapEx remains high while RPO growth slows or declines.
That could indicate that infrastructure is being built faster than new demand is arriving.
3. AI Compute Utilization
The third factor is AI compute utilization.
This is harder to measure because companies rarely disclose an explicit utilization rate for GPUs or AI clusters.
Low utilization would be a serious problem.
AI infrastructure carries large fixed costs, including:
- depreciation
- electricity
- cooling
- networking
- leases
- maintenance
If expensive compute capacity is underused, those costs continue even if revenue does not keep pace.
So how can investors estimate utilization without an official percentage?
Several proxies can help:
- Cloud revenue growth
- Capacity constraints
- AI usage growth
- Gross margin trends
- Depreciation growth
Microsoft, Amazon and Alphabet offer useful examples.
Comparison of AI Compute Utilization Conditions: MSFT, AMZN, and GOOGL
| Factor | MSFT | AMZN | GOOGL |
|---|---|---|---|
| Revenue absorption | 🟢 Very Strong | 🟢 Very Strong | 🟢🟢 Very Strong |
| Capacity tightness | 🟢 Very Clear | 🟢 Very Clear | 🟢 Very Clear |
| AI consumption evidence | 🟢 4x Copilot throughput | 🟢 AI + chips >US$25B run-rate | 🟢🟢 22B tokens/min |
| Margin response | 🟡 Cloud gross margin declined | 🟢 AWS margin improved | 🟢🟢 Cloud margin expanded sharply |
| Depreciation pressure | 🟡 High | 🟠 High | 🟠 Very High |
| Utilization conclusion | Very Strong | Very Strong | Very Strong |
Note: These indicators are proxies for AI compute utilization because the companies do not disclose a standardized GPU or AI compute utilization rate. The assessment combines cloud revenue growth, capacity constraints, AI usage trends, margin performance and depreciation growth.
Microsoft: Strong Utilization, but Rising Costs
Microsoft's Azure revenue grew 43% in fiscal fourth-quarter 2026, accelerating from 40% in the prior quarter and 39% before that.
Microsoft expects Azure growth to remain strong at roughly 45% in the following quarter.
The company has also said that newly added capacity is being monetized quickly, while AI usage has increased roughly fourfold since the start of 2026.
That is a strong utilization signal.
The drawback is margin pressure.
Microsoft Cloud gross margin fell from roughly 68% in fiscal 2025 to 65% in fiscal 2026.
That suggests demand remains healthy, but the cost of meeting that demand is rising quickly.
The warning sign would be Azure growth slowing while gross margin continues falling.
Amazon: Strong Economics Around AI Compute
Amazon Web Services may currently have one of the strongest combinations of growth and economics.
AWS revenue rose 36.7% to $42.2 billion, its fastest growth rate in 18 quarters.
AWS is also benefiting from strong AI demand across both services and custom silicon.
The key question is whether profitability is keeping pace with expansion.
AWS operating margin has remained strong even as the company continues to increase infrastructure spending.
At the same time, Amazon's depreciation burden is rising quickly, increasing about 28% to $75.2 billion.
As long as AWS revenue continues growing around 30% and margins remain at least stable, the economics still look healthy.
The warning sign would be AWS growth slowing sharply while depreciation continues rising 25% to 30% annually.
Alphabet: The Fastest Growth in AI Compute Demand
Alphabet is showing the strongest growth in AI-related cloud demand among the three.
Google Cloud revenue rose 82% to $24.77 billion in second-quarter 2026.
Growth was driven by:
- enterprise AI infrastructure
- enterprise AI solutions
- core Google Cloud Platform
The percentage growth is much higher than at AWS or Azure, though Google Cloud is operating from a smaller revenue base.
AI usage is also rising sharply.
Google reported roughly 22 billion API tokens processed per minute, up about 38% from the prior quarter.
Google Cloud operating margin also rose sharply, from around 20.7% to 35.6%.
That suggests the company is not merely adding infrastructure—it is converting higher AI demand into improving profitability.
The main risk is depreciation.
Alphabet's depreciation expense rose about 42% to $7.1 billion.
As long as Google Cloud revenue continues growing faster than depreciation, the buildout still appears economically productive.
If cloud growth eventually falls below depreciation growth, the economics would begin to look less attractive.
4. Debt Issuance Yields at Oracle and CoreWeave
The first three indicators focus on AI demand.
The fourth focuses on the cost of adding new supply.
This is particularly important for Oracle and CoreWeave because both are more dependent on external financing than companies such as Alphabet, Microsoft and Amazon.
The key metric is not just the Fed funds rate.
Investors should watch the yield on newly issued debt.
For example, if a company previously issued bonds at 6% but must issue new debt at 7.5%, the increase reflects not only higher benchmark rates but also potentially wider credit spreads.
That means lenders are demanding more compensation for risk.
Oracle has already raised about:
- $43 billion in debt
- $5 billion in equity
and has discussed another roughly $40 billion of debt or equity financing in fiscal 2027.
Oracle also reported roughly negative $5 billion of free cash flow in fiscal first-quarter 2027.
If the yield on new debt keeps rising while returns on AI infrastructure fail to keep pace, the economics of Oracle's expansion become less attractive.
The same logic applies even more strongly to CoreWeave.
Its leverage is higher, part of its debt is floating-rate, and AI infrastructure is extremely capital intensive.
For CoreWeave, investors should closely monitor:
- interest rates on new loans
- spreads over SOFR
- refinancing costs
If credit spreads widen at the same time the Fed raises rates, financial risk rises quickly.
5. Inventory at Super Micro and Dell
Super Micro and Dell have accumulated significant AI-related inventory.
That inventory includes GPUs, memory, networking equipment and other server components.
As long as hyperscaler projects proceed as scheduled, inventory can convert into revenue.
But if Microsoft, Amazon, Alphabet or other major customers delay deployment, suppliers may be left holding expensive components for longer.
That creates several risks:
- slower cash conversion
- higher working-capital needs
- financing pressure
- possible inventory write-downs
This is why inventory growth must be compared with backlog growth.
High inventory is less concerning when backlog is growing even faster.
High inventory becomes more dangerous when backlog weakens.
6. Data-Center Revenue Growth at Nvidia, Marvell and AMD
Another important indicator is whether hyperscaler capital spending is actually reaching suppliers such as Nvidia, Marvell and AMD.
The logic is straightforward. Hyperscalers first announce large capital-spending plans, then place orders for chips, networking equipment and other infrastructure. Suppliers manufacture and ship those products, and the spending eventually appears as revenue on their income statements.
That means supplier revenue can serve as a practical check on whether headline AI CapEx is translating into real demand.
If hyperscalers continue to maintain aggressive CapEx guidance but supplier revenue begins to slow, investors should look more closely at what is causing the disconnect. The issue may simply be timing, such as delayed customer deployments or slower project completion. It could also reflect supply constraints, including limited availability of advanced packaging, HBM or other critical components.
Another possibility is a shift in market share. For example, hyperscalers could continue spending heavily on AI while directing more of that budget toward custom silicon, alternative accelerators or different suppliers. In that case, weaker growth at one supplier would not necessarily mean the broader AI cycle is slowing.
The more concerning scenario would be a genuine decline in demand.
Nvidia is particularly important because Data Center revenue now accounts for the overwhelming majority of its business. If Nvidia's Data Center growth begins slowing sharply both year over year and sequentially, while gross margin also comes under pressure, that could suggest a meaningful deterioration somewhere in the hyperscale AI supply chain.
Marvell provides a different view of the cycle because its exposure is concentrated in custom silicon and high-speed data-center connectivity. Strong Marvell revenue and bookings would suggest that hyperscalers are still investing in custom accelerators and networking infrastructure even if spending patterns shift away from traditional merchant GPUs.
AMD requires a more nuanced reading. Its Data Center segment includes both EPYC server CPUs and Instinct AI accelerators. As a result, strong Data Center growth does not automatically mean AI accelerator demand is equally strong. Investors need to distinguish whether growth is being driven primarily by server CPUs or by the continued deployment of Instinct GPUs.
Taken together, Nvidia, Marvell and AMD can provide a useful picture of whether hyperscaler AI spending is continuing to flow through the semiconductor supply chain.
7. AI Networking Orders at Arista Networks
Arista Networks offers another useful window into the health of the AI infrastructure cycle.
Through the second quarter of 2026, Arista revenue rose 37.7% to $3.04 billion.
Networking is critical because large AI clusters cannot operate efficiently with GPUs working in isolation. Thousands of accelerators must communicate at extremely high speeds, which makes Ethernet fabrics, switches and other networking equipment an essential part of AI data-center construction.
For that reason, investors should pay attention not only to Arista's total revenue, but also to AI fabric revenue, order growth, contribution from major cloud customers, the transition from 800G to 1.6Tbps networking, lead times and customer concentration.
If GPU demand remains strong but Arista's AI networking orders begin to slow, that could indicate that customers are buying accelerators but building new clusters at a slower pace.
That would not necessarily mean AI demand has collapsed. Customers could be optimizing existing infrastructure or delaying part of a deployment. But if weaker networking orders persist for several quarters, it could become an early indication that the pace of new AI cluster construction is moderating.
8. Vertiv Backlog
Vertiv provides a different perspective because it sits closer to the physical infrastructure layer of the data-center buildout.
The company supplies critical systems including power equipment, cooling systems, thermal management and other infrastructure required to operate increasingly power-dense AI data centers.
Vertiv's backlog therefore offers a useful indication of how much physical data-center infrastructure has already been ordered but has not yet been completed or recognized as revenue.
As long as backlog remains strong, it suggests that customers are still committing capital to new data-center projects.
However, a decline in backlog must be interpreted carefully. Backlog can fall for healthy reasons if Vertiv is completing projects and recognizing revenue faster than it receives new orders.
The more concerning signal would be backlog declining alongside weaker order growth and a lower book-to-bill ratio. That combination would suggest that new orders are no longer replacing the projects being completed.
If that trend continued, it could become an early sign that physical data-center construction is beginning to lose momentum.
The Bigger Picture
Another 25 to 50 basis points of Fed tightening would not automatically end the AI boom.
The more important question is whether higher rates begin changing real corporate behavior.
If Amazon, Microsoft, Alphabet and Meta maintain their capital-spending plans, cloud RPO continues to grow, AI compute utilization remains strong and supplier orders keep expanding, higher rates would likely affect AI stocks primarily through valuation compression.
Higher interest rates raise the discount rate investors apply to future earnings. That can reduce the valuation multiples investors are willing to pay even when business fundamentals remain healthy.
In that scenario, AI stocks could fall even though earnings expectations remain largely intact.
A fundamental downturn would look very different.
The first warning sign would likely be hyperscalers cutting capital-spending guidance. That could then be followed by slower RPO growth and weaker utilization of new AI compute capacity.
If those trends continued, suppliers would begin to feel the impact. Revenue growth at Nvidia, Marvell and AMD could slow, while Super Micro and Dell might find that inventory is growing faster than backlog.
Arista could then see weaker AI networking orders, while Vertiv might begin reporting slower order growth and declining backlog.
At that point, the issue would no longer be limited to valuation.
AI stocks would face pressure from both lower valuation multiples and lower earnings expectations.
That would represent a much more meaningful shift in the AI infrastructure cycle.
The numbers are only the beginning.
Every week, Mikirduit US breaks down earnings, valuations, catalysts, and risks across U.S. stocks—so you can see what the market may be missing.
Mikirduit US provides independent financial research and educational content. This article is not personalized investment advice, and investors should conduct their own research before making investment decisions.